Contents
- 1 Introduction
- 2 Terminology
- 3 SQL Joins in General
- 4 Insight Data Model
- 5 Joining Two Tables
- 6 Joining Multiple Tables
1 Introduction
Many users will want or need to use SQL Questions to fulfill reporting requirements. Challenges for this task include:
- Understanding SQL syntax in general
- Understanding the Insight data model
- Understanding the report requirements
- Implementing the report correctly
This guide is aimed at helping with the first 2 challenges.
The intended audience is data analysts / data scientists, or project managers / team members with an interest in preparing their own reports.
Postgres Documentation
The Insight back-end is a database system called Postgres. When either using the Metabase Question Builder, SQL Questions, or some other query tool with a direct connection, ultimately the request for data is processed by Postgres.
Postgres has a vast feature set which is thoroughly documented online. Frequently useful entries include:
Note that the permissions for non-system Insight users only allow for reading data, so entries about modifying tables or updating data (insert/update/delete) are not relevant.
Other Resources
Among the hundreds of SQL guides and tutorials online, a beginner-friendly, interactive, and step-by-step tutorial is available for free at SQL Zoo.
2 Terminology
The following terminology and abbreviations are used in this guide.
- ES = Non-Repeating Event (S for Singular)
- GS = Non-Repeating Group
- ER = Repeating or Common Event
- GR = Repeating Group
3 SQL Joins in General
Join Types
There are 5 different join types available. For most queries however, only 2 of these will be necessary, with other 3 remaining useful for more advanced queries.
The main 2 join types are:
- Inner Join:
- a row for every match between Table A and B
- excludes non-matching Table A or B
- may result in multiple rows from Table A or B if there are multiple matches
- Left Join:
- for every Table A row, show Table B data if there is a match
- excludes non-matching Table B
- may result in multiple rows from Table A or B if there are multiple matches
The other 3 types are Cross Joins (all combinations of rows from both tables), Right Joins (opposite of Left), and Full Joins (all rows, but like doing both Left and Right at once).
Join Expressions
When defining a join, an expression that provides a boolean (true/false/null) result must be provided. This expression determines which rows will be included in the join result.
In Insight, the minimum join criteria will typically be the participant_table_id (OC4) or study_subject_table_id (OC3), which appears in most tables.
For more advanced queries, other metadata columns may be included in the expression, such as identifiers for the Event, CRF, Item Group, repeat keys, etc. The below sections discuss the various identifiers available.
4 Insight Data Model
Overview
The following slides illustrate the basic structure of the Insight data model. A common request is for a full Entity Relationship Diagram, but it is of limited usefulness since there are so many relationships defined.
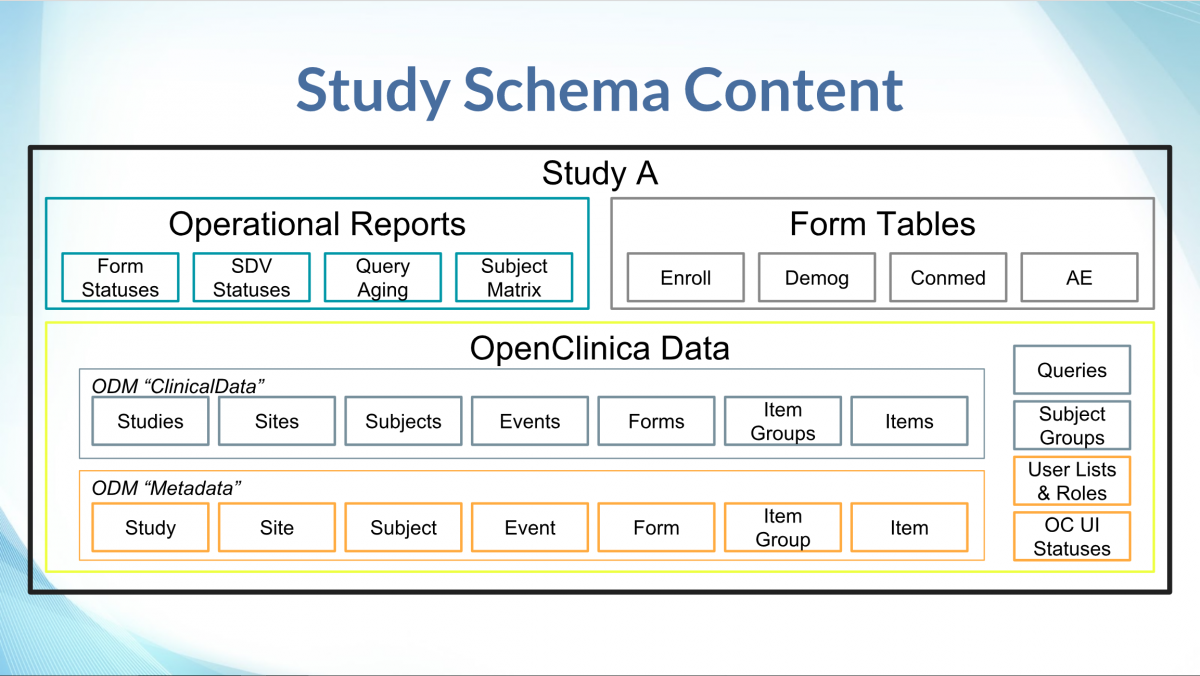
For those familiar with OpenClinica extracts, the Insight data model contains tables representing entities in the Metadata and ClinicalData elements, pivoted tables for form data, as well as some Operational reports.
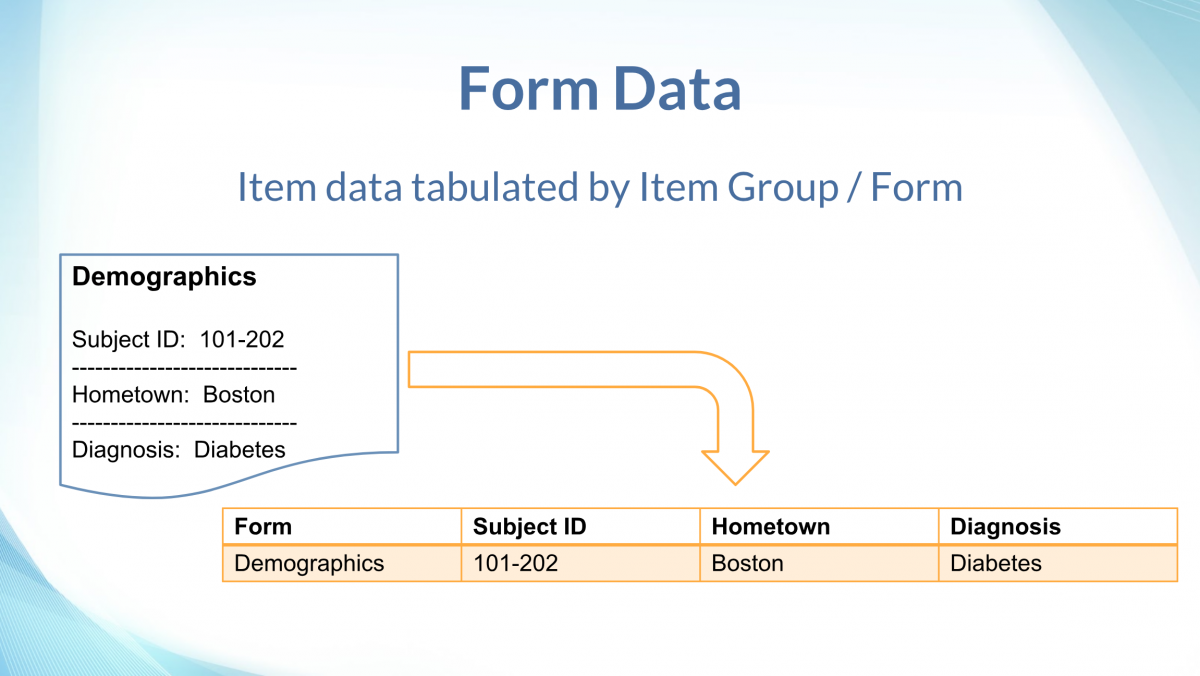
The form data tables take the list-like (entity-attribute-value / EAV) item data values, and “pivot” them such that each item is a column with it’s proper data type (text, numeric, date, etc.).
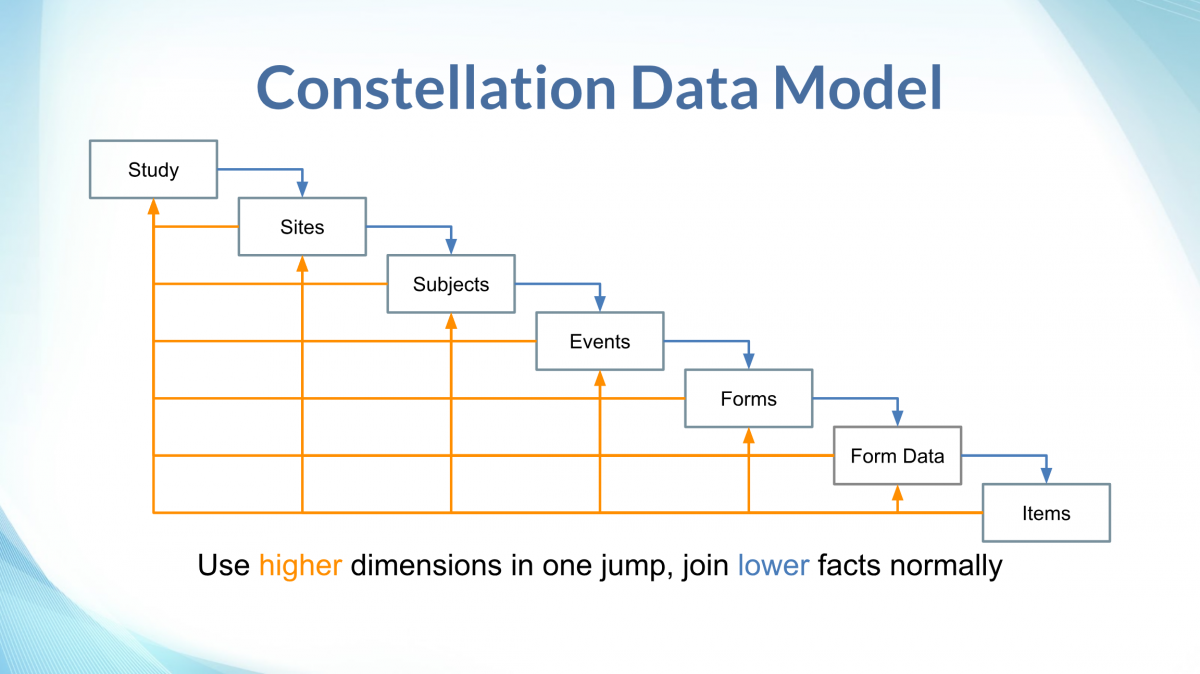
In reference to typical data warehouse terminology, the data model is most like a constellation, where there is a hierarchy of tables which can serve either as fact tables, or as dimensions of lower-level (higher detail) facts. Additionally, there many reference / dimension-only tables as well, such as lists of status choices.
Inspecting the Database
The Insight front-end has a built-in Data Reference, which catalogs the tables in each study schema (mart), and each table’s columns and column data types. These entries are annotated to help describe the meaning or purpose of the table or column. For common tables, such as Participants, Events, etc., these annotations are provided by OpenClinica as part of Insight. For form data tables, these annotations include information from the form definitions, such as the left-item-text for an Item column. In both cases, the description states the underlying table or column name, for quick reference when writing SQL.
To further inspect the structure of the database, users can query the Postgres System Catalog tables (in the pg_catalog schema), as documented at: https://www.postgresql.org/docs/current/catalogs.html. Alternatively, for users for whom a direct back-end connection has been set up, many database development tools provide inspection tools.
For example, the following query lists all the explicitly-defined foreign key relationships in the database, optionally filtered for a particular schema (uncomment and modify last line). The pg_catalog however can’t show implicit relationships, such as between two tables that both have an event_oid column.
SELECT
  nsp.nspname AS from_schema_name,
  cls.relname AS from_table_name,
  cna.attlist AS from_column_names,
  fns.nspname AS to_schema_name,
  fcl.relname AS to_table_name,
  cnf.attlist AS to_column_names,
  con.conname AS constraint_name,
  CASE con.confmatchtype
    WHEN 'f' THEN 'FULL'
    WHEN 'p' THEN 'PARTIAL'
    WHEN 's' THEN 'NONE'
  END AS match_type,
  CASE con.confupdtype
    WHEN 'c' THEN 'CASCADE'
    WHEN 'n' THEN 'SET NULL'
    WHEN 'd' THEN 'SET DEFAULT'
    WHEN 'r' THEN 'RESTRICT'
    WHEN 'a' THEN 'NO ACTION'
  END AS update_rule,
  CASE con.confdeltype
    WHEN 'c' THEN 'CASCADE'
    WHEN 'n' THEN 'SET NULL'
    WHEN 'd' THEN 'SET DEFAULT'
    WHEN 'r' THEN 'RESTRICT'
    WHEN 'a' THEN 'NO ACTION'
  END AS delete_rule
FROM pg_catalog.pg_constraint AS con
INNER JOIN pg_catalog.pg_namespace AS nsp
  ON nsp.oid = con.connamespace
INNER JOIN pg_catalog.pg_class AS cls
  ON cls.oid = con.conrelid
INNER JOIN LATERAL (
  SELECT
    array_agg(attname::text ORDER BY attname) AS attlist
  FROM pg_catalog.pg_attribute AS att
  WHERE att.attrelid = con.conrelid
    AND att.attnum = ANY(con.conkey)
) AS cna
  ON TRUE
INNER JOIN pg_catalog.pg_class AS fcl
  ON fcl.oid = con.confrelid
INNER JOIN pg_catalog.pg_namespace AS fns
  ON fns.oid = fcl.relnamespace
INNER JOIN LATERAL (
  SELECT
    array_agg(attname::text ORDER BY attname) AS attlist
  FROM pg_catalog.pg_attribute AS att
  WHERE att.attrelid = con.confrelid
    AND att.attnum = ANY(con.confkey)
) AS cnf
  ON TRUE
WHERE con.contype = 'f'
/*  AND nsp.nspname = 's_thejunod' */
Row Identifiers
There are 4 ways to identify rows in Insight, as described in detail below. The first two are auto-generated numeric IDs, best suited to join expressions. The second two are user-specified text IDs, best suited to filters but may also be used in join expressions.
First, each table has a “table_id” column which is typically named after the table, for example, the “participant” table has a “participant_table_id”. This column is an auto-generated in Insight, and has no particular meaning besides providing a convenient way to join tables together. Specific values should not be referred to in queries (e.g. WHERE participant_table_id = 3), since the table_id may change. Table IDs can change for example, if a participant is removed from the study and then later restored, or if the mart needs to be re-built during a version upgrade. To refer to / filter on specific values, use the relevant user-specified name or label, or the OID (see below).
Second, many tables include an “original_table_id” column, which is typically named after the table (or it’s source table), for example “participant_original_table_id”. This column is the auto-generated value from the source / transactional OpenClinica database, and has no particular meaning besides defining how to join tables together, and tracing Insight data back to the source. It can also be useful in tables with adjacency lists, for example the “Queries” / “discrepancy_note” table has a “parent_query_original_table_id” which for child-notes refers to it’s thread-title record’s “query_original_table_id”. A shortcoming (compared to the Insight table_id) is that if an Insight mart includes data from more than one source, the “original_table_id” may not be unique, in which case the study_oid would need to be included in the join expression.
Third, many tables have an OpenClinica “OID” column, which is a unique text identifier, typically derived from a name or label provided by a user. For example, the “Form Definitions” / “crf” table has a “crf_oid” column, which takes the first 12 alphanumeric / underscore characters from the “crf_name”, converted to uppercase. If two CRFs would have the same crf_oid, the second one would have an underscore then 3 or 4 random numbers appended to the end, to make it unique within the study (OC4) or unique across all studies (OC3).
Fourth, as mentioned above, many tables have a user-specified name or label column. Where the OID is a bit esoteric, the name or label can be used instead, for example it may be clearer to write WHERE crf_name = 'Demographics' rather than WHERE crf_oid = 'F_DEMOGRAPHICS'.
Form Data Tables
To simplify report preparation, a table is generated for each Item Group from all CRFs (Form Definitions) in the study. The Items in each Item Group is shown in table columns.
Item Group data from any usage of the relevant CRF, such as in Scheduled, Common, or Repeating Events are saved into the same table. The name of the table is the Item Group’s OID in lower case. Each row identifies where the data came from, including the site name, participant ID, event name, event repeat key, form name, form version, and item group repeat key. For example, if you use the same Visit CRF across a collection of Weekly Visits, the data in the Item Groups will already be collated. If you use slightly different forms for different visits, or want to combine totally different forms, SQL can be used to join or append data as needed.
Items in the Item Group are shown in columns, with a data type corresponding to the CRF definition: dates are dates, integers are integers, text is text, while files and partial dates are represented as text (where applicable). The name of the column is the Item’s OID in lower case. For single-select / radio items, the code value (not visible in the form) is shown in the column named with the Item’s OID, while the code label (visible in the form) is shown in a column named almost the same except it uses the prefix “il_” instead of “i_”. For multi-choice / checkbox items, the code values are shown as comma-separated values. While it is possible to look up the corresponding code labels in the form metadata, a future Insight version will aim to make working with multi-choice more convenient.
5 Joining Two Tables
The following are examples of joining two tables, and what happens in different scenarios depending on whether the data is from an Event which is repeating and/or the Item Group is repeating. A form may appear in many different events, both repeating and non-repeating, however whether the item group is repeating or non repeating does not vary.
In these examples then, it is assumed that there is a filter for the relevant Event e.g. WHERE event_name = 'Baseline', such that there is not a mix of repeating and non-repeating event data.
When Table A is ES+GS
When the Table A data is in a non-repeating event (ES) and non-repeating group (GS), then:
- And Table B is ES+GS, then:
- inner join result = A(ES:1,GS:1):B(ES:1,GS:1) or NULL:NULL
- e.g. show data for all participants with both Enrollment data and Study Termination data.
- left join result = A(ES:1,GS:1):B(ES:1,GS:1) or A(ES:1,GS:1):NULL
- e.g. show data for participants with Baseline Enrollment data, but who might not have Study Termination data.
- inner join result = A(ES:1,GS:1):B(ES:1,GS:1) or NULL:NULL
- And Table B is ES+GR, then:
- inner join result = A(ES:1,GS:1):B(ES:1,GS:1+N) or NULL:NULL
- e.g. show data for participants with both Baseline Demographic data and Baseline Medical History Log
- left join result = A(ES:1,GS:1):B(ES:1,GS:1+N) or A(ES:1,GS:1):NULL
- e.g. show data for participants with Baseline Randomisation, but who might not have any Baseline Concomitant Meds List data.
- inner join result = A(ES:1,GS:1):B(ES:1,GS:1+N) or NULL:NULL
- And Table B is ER+GS, then:
- inner join result = A(ES:1,GS:1):B(ER:1+N,GS:1) or NULL:NULL
- e.g. show data for participants with both Enrollment data and Repeating Visits data
- left join result = A(ES:1,GS:1):B(ER:1+N,GS:1) or A(ES:1,GS:1):NULL
- e.g. show data for participants with Baseline Demographic data, but who may not have any Ad-Hoc Follow-Up Visit data.
- inner join result = A(ES:1,GS:1):B(ER:1+N,GS:1) or NULL:NULL
- And Table B is ER+GR, then:
- inner join result = A(ES:1,GS:1):B(ER:1+N,GS:1+N) or NULL:NULL
- e.g. show data for participants with both Baseline Demographic data, and Common-Event Concomitant Meds Log data.
- left join result = A(ES:1,GS:1):B(ER:1+N,GS:1+N) or A(ES:1,GS:1):NULL
- e.g. show data for participants with Baseline Demographic data, but who may not have any Common-Event Adverse Event Sequelae List data.
- inner join result = A(ES:1,GS:1):B(ER:1+N,GS:1+N) or NULL:NULL
When Table A is not ES+GS
When the Table A data is repeating at the event level (ER) or group level (GR) and Table B is ES+GS, then the outcomes are the reverse of the above examples for “Table A is ES+GS”.
When and Table B is not ES+GS (that is, both tables repeat at either level), then there are many possible approaches, including:
- Ignoring the presence of repeats, which produces a results like a cross-join, where for example event repeats A1,A2 and B1,B2 are shown as A1:B1, A1:B2, A2:B1, A2:B2.
- Joining on the repeat keys, which essentially matches rows based on the order of data entry, for example joining on event repeats A1,A2 and B1,B2 to show A1:B1, A2:B2.
- Joining on some other row content, such as a Item which has the visit date, for example using data A1(01-Feb), A2(06-Oct) and B1(06-Oct), B2(01-Feb) to show A1:B2(01-Feb), A2:B1(06-Oct).
- Joining on a “best match” type of algorithm, where rows with the most Item matches are selected, for example ranking a match on both visit_date and participant_status above a match on only visit_date.
- Joining on some other criteria, for example correlating repeating follow-up form visit_date with repeating adverse-event form onset_date values that are after the previous follow-up (if any).
- Filtering out all but one repeat in Table A and B based on some criteria such that either (or both) tables are no longer repeating, for example matching only the most recent adverse event and follow-up visit for each participant.
6 Joining Multiple Tables
Example 1: Baseline Data Overview for Participants with Conmeds
- Title: Baseline Data Overview for Participants with Conmeds.
- Goal: show various baseline data together, but only where data exists across all 3 tables.
- Tables:
- Table A (ES1:GS1) = Baseline Demographics, data of interest: education level.
- Table B (ES1:GS1) = Baseline Enrollment, data of interest: enrollment date.
- Table C (ES1:GS1+N) = Baseline Concomitant Medications Log, data of interest: medication names.
- Result pattern: A(ES1:GS1):B(ES1:GS1):C(ES1:GS1+N) or NULL:NULL:NULL
Example SQL:
SELECT
  table_a.participant_id AS "Participant ID",
  table_a.il_demog_educ_level AS "Education Level",
  table_b.i_enrol_enrol_date AS "Enrollment Date",
  table_c.item_group_repeat_key AS "ConMed Repeat Key",
  table_c.i_conmed_conmed_name AS "ConMed Name"
FROM table_a
INNER JOIN table_b
  ON table_a.particpant_table_id = table_b.participant_table_id
INNER JOIN table_c
  ON table_c.participant_table_id = table_a.participant_table_id
Example Output:
| Participant ID | Education Level | Enrollment Date | ConMed Repeat Key | ConMed Name |
|---|---|---|---|---|
| 101-001 | High School | 2019-01-23 | 1 | Aspirin |
| 101-003 | University | 2019-02-06 | 1 | Ibuprofen |
| 101-003 | University | 2019-02-06 | 2 | Salbutamol |
Note that in the above output:
- Participant “101-001” has 1 ConMed recorded, and gets 1 row.
- Participant “101-002” had no ConMed data, so gets no rows (if we wanted to see Table A/B anyway, use LEFT JOIN table_c).
- Participant “101-003” has 2 ConMed group records, so it gets 2 rows with the same Table A/B data.