Introduction
While Insight incorporates documentation for reference within the reporting interface, it can be hard to know where to start. This guide explains how to find and work with commonly used data to answer frequently asked questions, using practical examples along the way.
It is possible to get started and answer questions without knowledge of SQL, but usually for more complicated questions, it is required. This guide does not assume SQL knowledge. If you need help, the professional services team can assist you with preparing SQL questions.
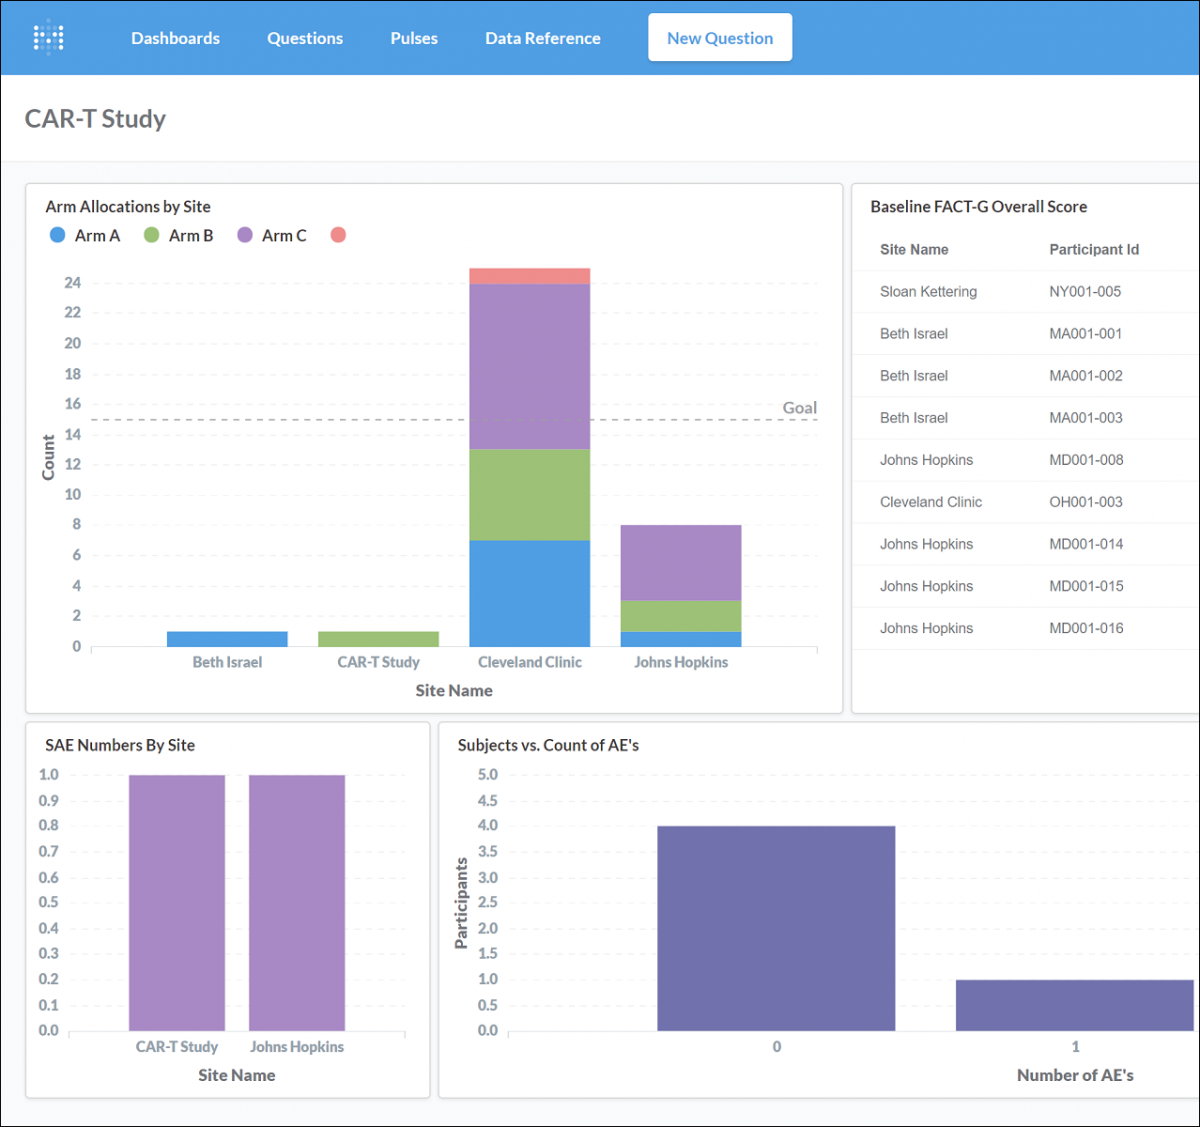
Insight allows you to view data in different ways. Below is an example of some of the ways you can view your data:
You can use the filters above the table to configure your screen to display different data. Below is an example of filters on the Event CRF table:
Questions About CRFs
Where are we with data entry? How is monitoring going? For answering questions about CRFs, there are two main tables to consider.
The first table is the Event CRF table, which contains a row for each copy of a CRF that has been started anywhere in the study. It includes details, such as, the site, Participant, Event, status, SDV status, and links to many other tables to make it possible to include (join) extra details in a question (such as the study Start Date, Event Start Date, etc.)
The second table is the Participant Matrix, which contains a row for each CRF, which can be started by each Participant in the study at any time during the study. The concept is similar to the Participant Matrix in OpenClinica, in which users see started and possible Events in the study for each Participant. This table contains fewer details about Event CRFs than the first table but does have a link back to the Event CRF table so that it is possible to include (join) any extra details in a question.
CRF Status Examples
The Event CRF and Participant Matrix tables can be used to answer the following questions about CRF statuses:
How many started CRFs are there?
1. Select the Event CRF table.
2. Select Count of rows.
How many completed CRFs are there?
1. Select the Event CRF table.
2. Add a filter for Event CRF Status is data entry complete.
3. Select Count of rows.
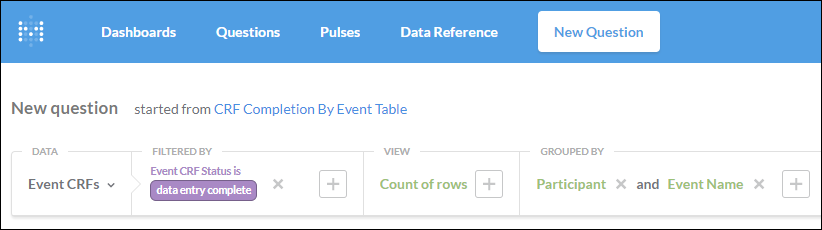
Can the above be separated per Event and per Participant and a total of all completed CRF’s per Event/Participant?
1. Select the Event CRF table.
2. Add a filter for Event CRF Status is data entry complete.
3. Select Count of rows.
4. Group by Participant Id and Event Name.
The Event CRF filter screenshot shows this fully-formatted question, in addition to the two questions above.
What is the percentage of completed CRF’s compared to expected CRFs? What is the definition of expected CRFs?
A standard question called CRF Completion By Event shows percentages completed, not completed, and total (by site and Event). This question uses the Participant Matrix and considers an Event CRF to be complete if the Event CRF Status is data entry complete. In this question, the definition of expected for any Participant is any CRF in the study definition, plus CRFs in started Events (such as repeats).
Can the definition of an expected CRF be customised? For example, is it possible to incorporate an expected time window, or a rule like that the End of Study Form is not expected to be completed until the End of Treatment Form has been completed?
Often the definition of an expected CRF is study-specific, intricate, and considers both study metadata and a Participant’s Form data. Typically, such definitions are implemented in a SQL question, in which it is possible to use conditional logic expressions, multiple data processing steps, date calculations, combinations of data from multiple tables, and much more.
SDV Status Examples
The Event CRF and Participant Matrix tables can be used to answer the following questions about SDV statuses:
How many SDV’d CRFs are there?
1. Select the Event CRF table.
2. Add a filter for SDV Status is True.
3. Select Count of rows.
Can the above be separated per Event and per Participant and a total of all completed CRF’s per Event/Participant?
1. Select the Event CRF table.
2. Add a filter for SDV Status is True.
3. Select Count of rows.
4. Group by Participant Id and Event Name.
How can Forms that are not SDV’d yet be identified? What about Forms that were previously SDV’d but then invalidated due to data changes?
The default value for the SDV status column is False, so to find started Event CRFs that have never been SDV’d, add a filter for SDV status is False.
To find previously SDV’d CRFs, use the column named SDV reset after true, in which True means the SDV status is currently False but the Audit Log recorded it as being true before, False means the SDV status is currently True, and empty means the SDV status has never been changed from the default (False).
The column SDV last true shows when (if ever) the SDV status was last set to True.
What is the percentage of SDV’d CRFs compared to expected CRFs? What is the definition of expected CRFs?
A standard question called SDV By Event shows percentages SDV’d, not SDV’d, and total (by site and Event). This question uses the Participant Matrix and considers an Event CRF to be expected if either 100% Required or Partial Required is selected for the CRF’s SDV metadata in it’s Event definition.
Questions about Queries
Where are we with data cleaning? Have the sites been responding to queries? For answering questions about queries, view the Queries table.
The Queries table contains details of queries, such as:
- Query type (query, reason for change, etc.)
- Resolution status (new, updated, closed, etc.)
- When the query was created.
- Who the query was created by.
- Who the query is currently assigned to.
Since each query is attached to something (such as an item data value or study Event field), some identifying information about that value or field is shown in the Queries table and links back to the relevant table for full details.
Each row in this table corresponds with an action on the query. For example, there would be a row for when the monitor created the query, another row for when the site responded, and another row for when the data manager closed the query.
The first query action row is considered the “parent” query, and the subsequent rows for that query are connected by the column named Parent Query Original Table Id to the parent’s Query Original Table Id.
Note: If you create a query in SQL and download a spreadsheet it should be limited to 300,000 rows or less to prevent the download from crashing.
Examples
The Queries table can be used to answer the following questions about queries:
How many Queries are there?
1. Select the Queries table.
2. Add a filter for Parent Query Original Table Id is (empty).
3. Select Count of rows.
Can the above be separated by resolution status, Participant, and site?
1. Select the Queries table.
2. Add a filter for Parent Query Original Table Id is (empty).
3. Select Count of rows.
4. Group by Resolution Status, Participant Id, and Site Name.
Can the above be separated by the issuing user, and assigned user?
1. Select the Queries table.
2. Add a filter for Parent Query Original Table Id is (empty).
3. Select Count of rows.
4. Group by Created By and Assigned To.
Can I report on these user’s more generally, for example by the user role type (monitors vs. CRC vs. Data Manager)?
It is possible with a SQL question. The role types that a user has assigned to them are listed in the User Account Role table, which is linked to the User Account table by user account Id, and the Queries table can be matched with the User Account table by user name. Since a user can have multiple roles in a study, care should be taken to not double count queries assigned to a user with two roles.
Can I report on the time between status changes? For example, how long did it take for the site to respond to the initial query?
It is possible with a SQL question. If we consider a set of query action rows associated with their parent query, ordered by their Created timestamp, a SQL feature called “Window functions” can be used in the query to fetch the previous (“lag” function) or next (“lead” function) row within that set of rows. By fetching the adjacent rows it’s then possible to calculate the time between query actions, for example:
[previous row created timestamp] minus [current row created timestamp] equals [the time between updates]
Once the time differences (in hours, days, etc.) are calculated for each row, these results can be grouped by assignee, role type, site, etc.
Questions about Participants
How is enrollment going? Where are most of the Participants up to? For answering questions about Participants, start with the Participants table, and combine with Form data, if needed.
The Participants table contains details for each Participant, such as their Id, when they were entered in the system, and to which site they are assigned.
Examples
The Participants table can be used to answer the following questions about Participants:
How many Participants are there?
1. Select the Participants table.
2. Select Count of rows.
Can the above be separated per site?
1. Select the Participants table.
2. Select Count of rows.
3. Group by Site Name.
To simplify question building and table relationships, Insight considers the top-level, “study,” a site (i.e., answering this question does not require grouping by study then site).
Can I report on other Participant statuses that are collected on my CRFs, such as screening failure, end of treatment, end of study, etc.?
It is possible with a SQL question. Usually the CRFs that collect Participant milestones are completed once (Non-Repeating Events), so the approach could be to:
1. Identify which Item Group table that each milestone data is in (the table name is the Item Group OID, and the column name is the Item OID).
2. Start with the Participant table so that there is a row for every Participant (no matter their progress) and join each Item Group table using the “participant_table_id”
3. Apply the necessary filters/logic/calculations for the question, such as, including or excluding screening failures, calculating the difference between screening and baseline date, etc.
Questions about Form Data
How many Adverse Events have been recorded? How often are some key outcome data items left unanswered? For this we must get into the data captured on your CRFs.
The data entered into CRFs are shown in Insight in two main ways:
The first way is in the Item Data table, in which there is a row for every (non-removed) item data value in the entire study. This table contains the data value, when and who it was created by, when and who it was last updated by, as well as details of the related Event CRF, study Event, Participant, and associated metadata such as the data type (text, integer, etc.) and response set choices (e.g. for single-select, multi-select, etc.).
The item data types map into 4 main types, each with their own column: text, date, numeric (float/real), or integer.
Since the values are actually stored as text, the Data Text column is always populated, and if there was a problem in converting the text value to its proper type, the Cast Failure column is True.
If the item’s response type uses single-select choices, then the Option Label column shows the relevant label for the selected value. Items using multi-select choices are currently displayed as a text list of comma-separated values (however it is possible to process these values and look up the labels in a SQL question if needed).
The second way item data is shown is through the pivoted Form data tables, with display names that are formatted as, “Form Name – Item Group Name” (e.g. “Demographics – DEMOG”) and back-end (SQL) names that have the Item Group OID (e.g. “IG_DEMOG”). These pivoted tables take the item data values for an Item Group, and group them by Participant, study Event Repeat, and Item Group Repeat, so data from all Event usages and versions of the Item Group’s Form are shown together with the values for each item in their own column.
The item column display names are the item name (e.g. “EDUCATION”), and the back-end (SQL) name is the Item OID (e.g. “I_DEMOG_EDUCATION”). If the item response type uses single-select choices, then an additional column is created to show the relevant label for the selected value, with a display name that uses the format “Item Name – Label” (e.g. “EDUCATION – Label”) and the back-end (SQL) name that uses the Item OID, except with the letter “L” after the “I” prefix (e.g. “IL_DEMOG_EDUCATION”).
Examples
The tables described above can be used to answer the following questions about Form data.
How many doses of treatment has each Participant received?
Assuming there is one treatment Form (e.g. Treatment – TRT) that is completed multiple times (either in different Events, e.g. Week 1, Week 2, etc. or a Repeating Event), which has a “Was treatment given?” yes/no status item (e.g. TRTSTATUS):
1. Select the Item Group table, Treatment – TRT
2. Add a filter for Yes in the TRTSTATUS – Label column.
3. Select a Count of rows.
4. Group by Participant Id.
Approximately how many item data values were entered by each user?
1. Select the Item Data table.
2. Select Count of rows, and group by Saved By. (This is the user that either last updated the value, or if it was never changed, it is the user who initially created the value.)
Can the above be separated by week?
Follow the above steps, then add a grouping on Saved, and change its grouping time scale from the default (Day) to Week.
I have a Form where the items are in 2 or more groups. How do I combine them into one table?
It is possible with a SQL question. In an upcoming release of Insight, the Query Builder will be enhanced so that these combinations can be done with a point-and-click user interface instead of requiring the user to write the equivalent SQL. If all Form usages are in Non-Repeating Events, the Item Group tables can be combined with just the Participant Id, keeping in mind that if one or more of the Item Groups are Repeating, then the other table’s rows are repeated for each repeat.
If some Form usages are in Repeating Events, the Item Group tables can be combined with the Event CRF Table Id, which uniquely identifies a copy of a CRF within a specific Participant’s Event. If there is a relationship between the rows of a Repeating Group (e.g., row 3 of the Adverse Events Item Group corresponds to row 3 of the SAE Reporting Log Item Group) then the join criteria must include the Item Group Repeat Key.