16.3.1 Data Manager and Study Director Home Page
A Data Manager and Study Director see the same information in the home page. It shows summary tables for the current Study or Site: Subject Enrollment By Site, Subject Enrollment For Study, Study Progress, and Subject Status Count.
In the percentage columns, the amount of highlighting represents the percentage number. For example, 0% is not highlighted at all, 50% is half highlighted, and 100% is fully highlighted.
Home Page for Data Manager and Study Director Roles, at the Study Level:
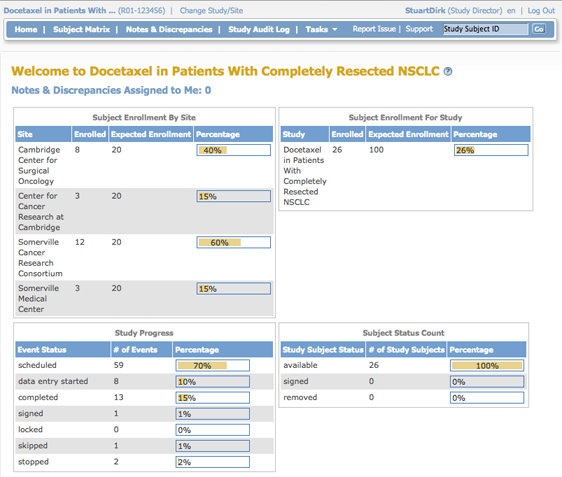
Subject Enrollment by Site
This table is a summary of enrollment at each Site in the Study:
- Site: Name of Site.
- Enrolled: Number of Subjects who met the criteria for the protocol and have already enrolled at that Site.
- Expected Enrollment: Total number of Subjects expected to enroll at that Site, based on preliminary data collected for the Study protocol.
- Percentage: The number of Subjects enrolled divided by expected enrollment for that Site.
Subject Enrollment For Study
This table is a summary of enrollment at the Study level (This table is not shown when the Current Study or Site is set to the Site level):
- Study: Name of Study.
- Enrolled: Number of Subjects who met the criteria for the protocol and have already enrolled in the Study.
- Expected Enrollment: Total number of Subjects expected to enroll in the Study, based on preliminary data collected for the Study protocol.
- Percentage: The number of Subjects enrolled divided by expected enrollment for the Study.
Study Progress
This table is a summary of Events for the current Study or Site, reporting the progress that has been made within each Event:
- Event Status: Values that Event Status can be set to, for all Events in the Study or Site.
- Number of Events: The number of Events in the Study or Site having that status.
- Percentage: The number of Events having that status divided by the total number of Events in the table.
Subject Status Count
This table is a summary of the status of Subjects in the Study:
- Study Subject Status: Values that Subject Status can be set to.
- Number of Study Subjects: The number of Study Subjects currently having that status, including any Subjects removed from the Study.
- Percentage: The number of Subjects whose Subject Case Books have been signed (after all Events for the Subject were signed) divided by total enrollment for the Study.
Tasks Available to a Data Manager or Study Director
Modules (groups of Tasks) available for the Data Manger and Study Director are:
- Submit Data
- Monitor and Manage Data
- Extract Data
- Study Setup
- Other
Some of the Tasks a Data Manager or Study Director can perform are:
- Create and Manage CRFs
- Create and Manage Event Definitions
- Create and Manage Rules
- View and Manage Events
- Create and Manage Sites
- Manage Subjects
- Manage Study
- Extract Data
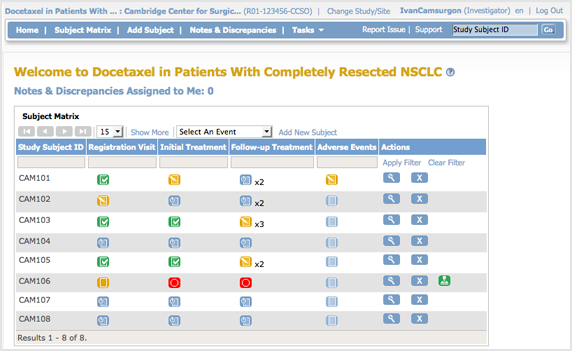
16.3.2 Investigator Home Page
The body of the home page for a user whose role is Investigator for a Site shows the Subject Matrix for the Site.
Tasks Available to an Investigator
Modules (groups of Tasks) available for the Investigator are:
- Submit Data
- Extract Data
Some Tasks an Investigator can perform are:
- View Datasets
- Create Datasets
- Sign Subject Data
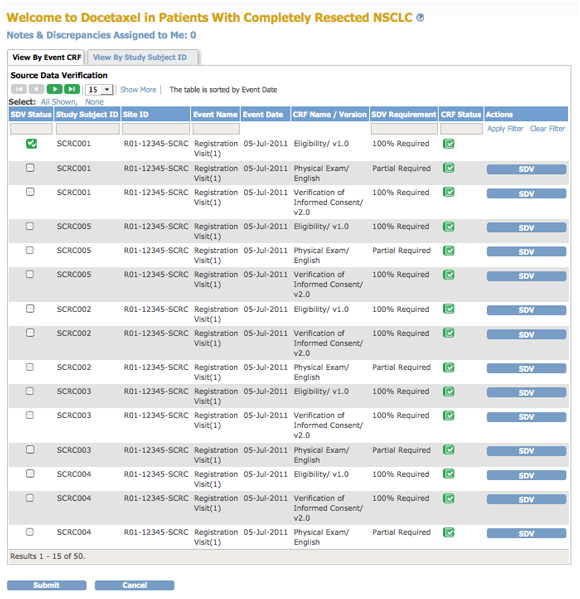
16.3.3 Monitor Home Page
The body of the home page for a user whose Role is Monitor shows the Source Data Verification (SDV) table.
If you are a Monitor for a Site, the SDV table includes only Subjects and data for that Site. If you are a Monitor for a Study, the table includes all Subjects and data for the Study.
The Source Data Verification table provides two views of data, which you access from the tabs at the top of the table:
- View By Event CRF: Use this view to evaluate the conformity of the source data in CRFs. The view shows only CRFs that are ready for Source Data Verification, that is, marked complete.
- View By Study Subject ID: Use this view for all Subjects, whether or not they are ready for Source Data Verification.
For more information, see Source Data Verification.
Tasks Available to a Monitor
Modules (groups of Tasks) available for the Monitor to use are:
- Monitor and Manage Data
- Extract Data
Some Tasks a Monitor can perform are:
- View All Subjects
- View Events
- Notes & Discrepancies
- Source Data Verification
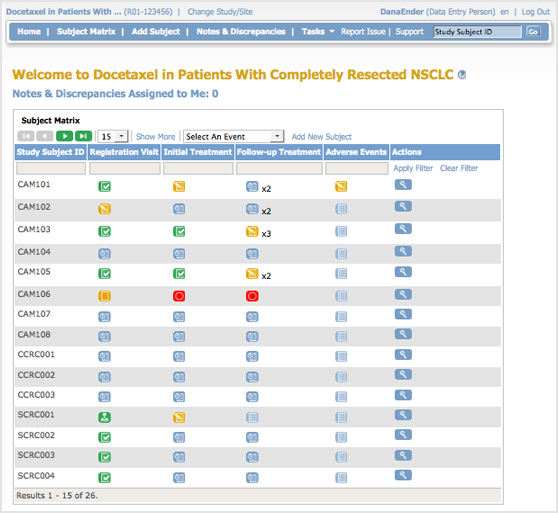
16.3.4 Data Entry User Home Page
The body of the home page for a user whose Role is Data Entry shows the Subject Matrix. The Subject Matrix is a table with Event information for all Subjects in a Study. You can view, enter, and change information for Subjects and their Events in the Study. There is one Subject per row, with the Study Subject ID in the first column. The other columns are for each Event in the Study. Each cell contains a colored icon that identifies the status of Event(s) for the Study Subject. See more details about the Subject Matrix.
Tasks Available to a Data Entry User
Modules (groups of Tasks) available for the Data Entry user are:
- Submit Data
Some Tasks a Data Entry user can perform are:
- View All Subjects
- Add Subjects
- Add New Study Events
- View Study Events
16.3.5 Data Specialist Home Page
The body of the home page for a user whose Role is Data Specialist shows the Subject Matrix. The Subject Matrix is a table that has one row of information per Subject in a Study, with the Study Subject ID in the first column. You can view, enter, and change information for Subjects and their Events in the Study. The other columns are for each Event Definition in the Study. In each cell of the matrix, an icon identifies the status of Event(s) for that Study Subject. Move the cursor over an icon in the matrix to view and access a Subject’s data and actions for that Event. Refer to the Icon Key in the sidebar for icon descriptions. See more details about the Subject Matrix.
Tasks Available to a Data Specialist
Modules (groups of Tasks) available for the Data Specialist to use are:
- Submit Data
- Extract Data
- Other
Some Tasks a Data Specialist can perform are:
- View All Subjects
- Add Subjects
- Add New Study Events
- View Study Events
- View Datasets
- Create Datasets
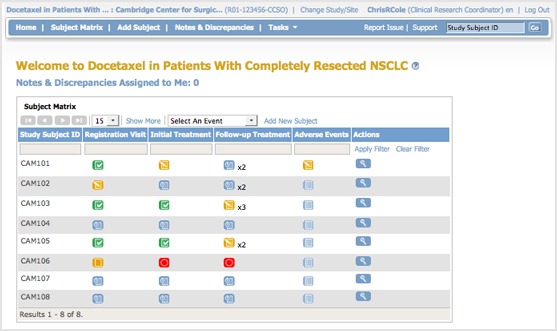
16.3.6 Clinical Research Coordinator Home Page
The body of the home page for a user whose role is Clinical Research Coordinator shows the Subject Matrix for their Site. The Subject Matrix is a table with Event information for all Subjects in a Study. You can view, enter, and change information for Subjects and their Events in the Study. There is one Subject per row, with the Study Subject ID in the first column. The other columns are for each Event Definition in the Study. Each cell contains an icon that identifies the status of Event(s) for the Study Subject. Move the cursor over an icon in the matrix to view and access a Subject’s data and actions for that Event. Refer to the Icon Key in the sidebar for icon descriptions. See more details about the Subject Matrix.
Tasks Available to a Clinical Research Coordinator
Modules (groups of Tasks) available for a Clinical Research Coordinator are:
- Submit Data
Some Tasks a Clinical Research Coordinator can perform are:
- View All Subjects
- Add Subjects
- Add New Study Events
- View Study Events
- Enter CRF Data